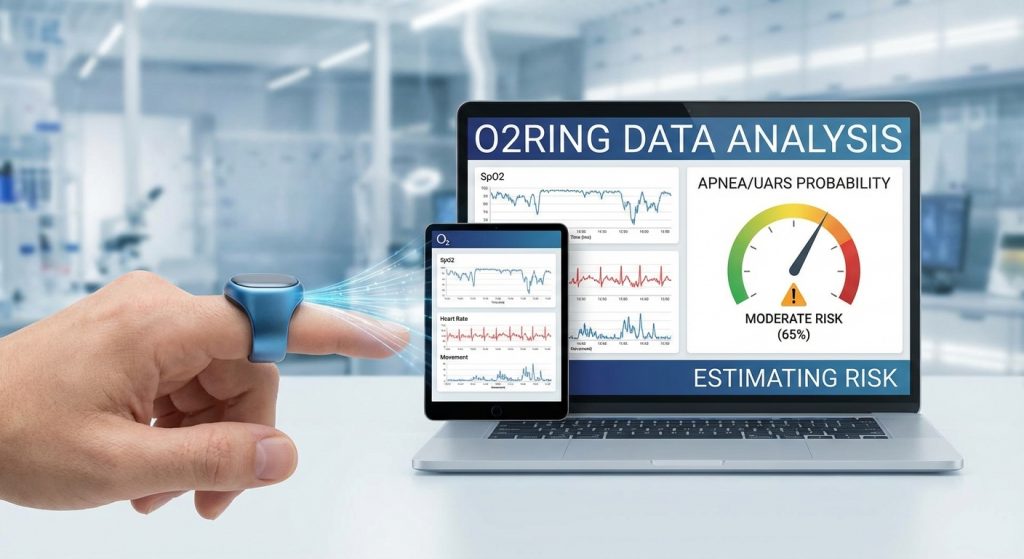
You suspect something is wrong. You wake up tired, your partner says you twitch, or perhaps your Apple Watch threw a vague “low oxygen” alert. You want answers, but the waitlist for a sleep clinic is six months long.
This is where the Wellue O2Ring changes the game.
I am not a doctor. I am a patient who has spent years debugging my own sleep. Even though my Polysomnography (PSG) eventually ruled out severe Apnea, I continue to use the O2Ring nightly. Why? because it provides granular data—every 4 seconds—that allows me to spot “bad nights,” sympathetic storms, and the effects of lifestyle choices.
In this guide, I will show you O2Ring data analysis techniques to estimate your risk of Obstructive Sleep Apnea (OSA) and the elusive Upper Airway Resistance Syndrome (UARS) from the comfort of your bed.
Why the Wellue O2Ring? (And Why Pharmacy Oximeters Fail)
A common mistake is buying a $20 finger-clip oximeter from the drugstore. These are useless for sleep analysis.
1. Spot Check vs. Continuous: Cheap devices are meant for spot checks. They do not record data all night.
2. Sampling Rate: To detect apnea risk at home, you need high-resolution data. The O2Ring records oxygen and heart rate every 4 seconds. Most smartwatches (Apple, Garmin) only sample every 15–30 minutes to save battery. A lot of apnea events happen in 20-second bursts; a watch will miss them entirely.
3. The Form Factor: The ring design (silicone loop) stays on. Finger clips fall off the moment you toss and turn.
My Personal Verdict (Rating: 9/10):
I use this device nightly with my iPhone 16 Pro Max. It is comfortable enough to wear on my middle finger (the best spot for accuracy). It allows me to disable the screen and vibration, making it invisible to my sleep partner.
The Flaws:
- The Red Light Bleed: In a pitch-black room, a faint red glow from the sensor can sometimes shine through the silicone. If you are light-sensitive, this can be annoying.
- The Bluetooth Quirk: You must manually disconnect the device from the app (“Disconnect Device” button) in the morning. If you forget, it stays paired and refuses to accept a charge.
- Charging: It must be charged every day.
Despite these quirks, it is the 80% solution. In 80% of cases, this ring will either confirm or debunk your suspicions, saving you months of wondering.
How to Set Up for Data Collection
To get clean data for reading pulse oximetry, follow these steps:
- 1. Placement: Wear it on the index or middle finger (thumb is okay, but middle often has the best perfusion). Ensure the sensor sits on the fleshy pad of the finger, not the bone.
- 2. Settings: In the ViHealth app, go to Settings. Turn Vibration Intensity to OFF for the first few nights. You want to observe your natural sleep, not be woken up by the alarm every time you drift off.
- 3. Syncing: In the morning, take it off. Open ViHealth on your phone. The data will sync via Bluetooth automatically.
The Basics: Reading the Report
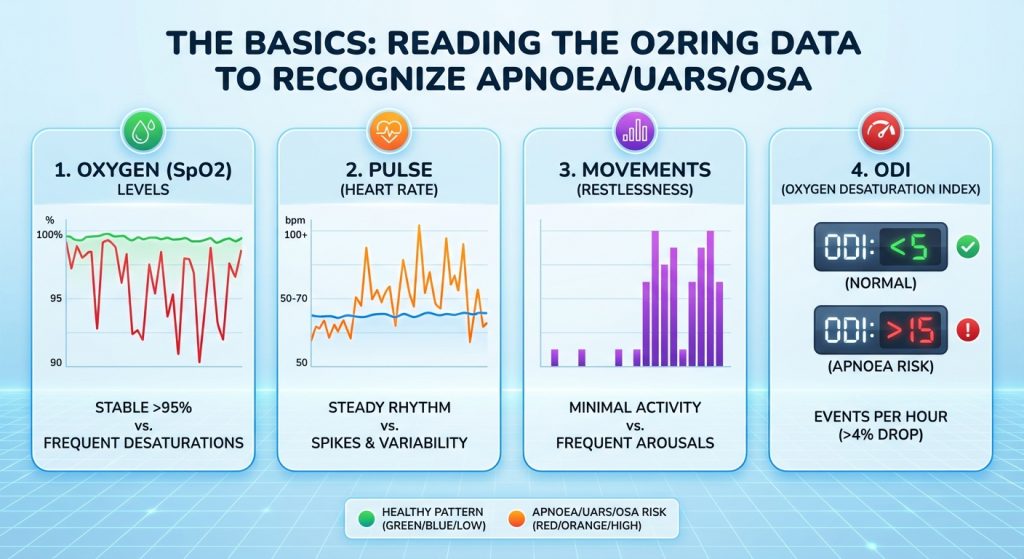
When you look at your nightly report (PDF or CSV), you are looking for three lines:
- 1. SpO2 (Blood Oxygen): Your fuel gauge.
- 2. Pulse Rate: Your engine speed.
- 3. Motion: Are you thrashing around?
1. Oxygen Saturation (SpO2)
Normal: 95%–99%.
Concerning: Frequent drops below 90%.
Dangerous: Drops below 88% or 85%.
2. ODI (Oxygen Desaturation Index)
This is the most critical number the app calculates. It measures how many times per hour your oxygen dropped by 3% or 4% from baseline.
- ODI < 5: Normal.
- ODI 5–15: Mild issues.
- ODI 15–30: Moderate.
- ODI > 30: Severe.
Scenario A: Detecting Obstructive Sleep Apnea (OSA)
The Pattern: The “Sawtooth” Drop.
If you have classic Apnea, your throat closes, you stop breathing, oxygen drops, and your heart spikes to wake you up.
What to look for in the O2Ring Data:
- 1. The Drop: Look at the SpO2 line. You will see deep, V-shaped valleys. The oxygen drifts down (e.g., from 96% to 84%) over 20-30 seconds.
- 2. The Spike: Immediately after the lowest oxygen point, look at the Pulse Rate. You will see a sharp vertical spike (e.g., heart rate jumps from 55 to 110 bpm). This is the adrenaline surge as you gasp for air.
- 3. The Repetition: This pattern repeats cyclically. Drop-Spike-Recover. Drop-Spike-Recover.
- 4. The Movement: Often, there is a movement bar right after the pulse spike.
Verdict: If your ODI is high (>10) and you see these V-shaped drops, there is a very high probability you have OSA. You should book a doctor’s appointment immediately.
Scenario B: Detecting UARS (The “Silent” Killer)
Upper Airway Resistance Syndrome (UARS) is harder to spot because oxygen often stays stable. The airway narrows but doesn’t fully close. You work incredibly hard to breathe, causing stress, but you don’t choke.
The Pattern: The Sympathetic Storm.
What to look for in the O2Ring Data:
- 1. Stable Oxygen: Your SpO2 line might look perfect (95-97%). Do not let this fool you.
- 2. The Pulse “Hairbrush”: Look at your Heart Rate graph. Instead of a smooth, low line, does it look like the bristles of a hairbrush? Frequent, jagged spikes (e.g., 60 bpm to 85 bpm back to 60 bpm) every few minutes indicate detecting flow limitation.
- 3. Baseline Pulse: Is your average sleeping heart rate high (>75 bpm)? This indicates your body is fighting to breathe all night.
- 4. UARS Probability: If you have Cold Hands/Feet, anxiety, and low blood pressure, combined with a “spiky” heart rate graph but normal oxygen, this is the classic UARS signature.
Alex’s Note: Even though I don’t have UARS, I look for these pulse spikes to judge my sleep quality. A flat heart rate line means a restful night. A jagged line usually means I ate too late (see The Anti-Sleep Diet) or my pillow height was wrong, causing airway restriction.
Advanced Analysis: Using CSV Data and AI
Unlike some huge companies, which hide your raw data, Wellue allows you to export everything. This is a massive advantage.
How to export:
- 1. Go to the History tab in ViHealth.
- 2. Select the night.
- 3. Click the “Share” icon (top right).
- 4. Choose CSV or PDF.
The Desktop Advantage (O2 Insight Pro):
You can connect the ring via USB to a PC or Mac and use the free O2 Insight Pro software. This allows you to zoom in much closer than the mobile app. You can see the exact second-by-second correlation between a pulse spike and a movement event.
Using AI for Analysis:
Since the CSV contains raw numbers (Time, SpO2, Pulse, Motion), you can upload this file to AI tools like ChatGPT (Plus) or Google Gemini.
Prompt: “Analyze this sleep data. Look for correlations between heart rate spikes and oxygen drops. Calculate the percentage of time spent below 90% SpO2. Look for patterns indicative of UARS (pulse spikes without desaturation).”
Result: The AI can often spot trends that are invisible to the naked eye in a PDF chart.
What is a “Bad” Night? (When to Worry)
Not every drop is Apnea. Here is how to filter the noise.
False Positives:
- Compression: If you sleep on your hand, you might cut off blood flow to the finger. This results in a “square wave” drop—oxygen goes from 97% to 80% instantly, stays flat, and shoots back up. This is an artifact, not apnea.
- Bathroom Breaks: The O2Ring detects when you are awake. If you see a massive spike in movement and heart rate at 3 AM, check if it correlates with a bathroom trip.
True Concerns:
- Time below 90% (T90): If you spend more than 1% of the night below 90% oxygen, that is clinically significant.
- Sympathetic Storms: If your heart rate never settles below 60-65 bpm (and you are otherwise fit), your body is stressed.
O2Ring vs. Competitors
1. WatchPAT One (The Medical Upgrade):
The O2Ring is a screening tool. The WatchPAT One is a diagnostic tool. The WatchPAT measures “PAT Signal” (Peripheral Arterial Tone), which can detect UARS (RERAs) with much higher accuracy.
Pros: Medical diagnosis, accepted by some doctors.
Cons: Much more expensive, single-use disposable.
Use O2Ring for nightly tracking. Use WatchPAT One to confirm a diagnosis before seeing a doctor.
2. Apple Watch / Garmin / Samsung Ring:
Pros: You already own it.
Cons: Low sampling rate (unless you have the newest Apple Watch Series 9/10/Ultra 2 with specific apnea features). They smooth out data, hiding the sharp spikes you need to see.
3. Cheap Finger Clips:
Verdict: Garbage for sleep. They fall off and don’t record.
Next Steps
You have analyzed your data. What now?
If your data looks bad (High ODI or Spiky Pulse):
- 1. Do not panic. This is actionable data.
- 2. Confirm: If you can afford it, order a home sleep test like the WatchPAT One or similar Type 3 device.
- 3. Consult: Take your PDF reports to a GP or Somnologist. “Doctor, here is a month of data showing nightly desaturations to 84%.” It is hard for them to ignore hard data.
- 4. Treatment: If confirmed, you may need CPAP or BiPAP therapy. (Note: Only use CPAP if a sleep study confirms the need).
If your data looks good but you are still tired:
- Check your Sleep Hygiene.
- Investigate metabolic causes (Glucose spikes).
- Consider Restless Legs Syndrome.
Update for December 2025: O2Ring “S” Model, AI Diagnostic Bots
Since I first published this guide on analyzing O2Ring data, the tools available to patients have evolved. We are no longer limited to the basic PDF report. In 2025, we have cloud platforms and high-resolution hardware that make spotting UARS significantly easier.
1. The 1-Second Advantage (O2Ring S)
In late 2024, Wellue released the O2Ring S.
The Difference: The original model sampled every 4 seconds. The new S model samples at 1Hz (1 second).
Why it matters for UARS: Flow limitations (struggling to breathe) cause micro-arousals that can last just 3-5 seconds. The 4-second model sometimes “averaged out” these spikes. The 1-second model captures the jagged “sawtooth” of the heart rate with much higher fidelity.
Recommendation: If you suspect UARS specifically, the upgrade to the “S” model is worth it for the cleaner Pulse Rate data.
2. AI Diagnostic Bots (The New “Doctor”)
You don’t need to be a data scientist to read CSV files anymore.
The Tool: Specialized GPTs (like “Sleep Data Analyzer”) have emerged.
The Workflow: Export your CSV -> Upload to ChatGPT 5+/Gemini 3+/Claude -> Prompt: “Identify clusters of desaturations below 4% and correlate them with pulse spikes.”
The Result: The AI can often identify Positional Apnea (e.g., “Your drops only happen between 2 AM and 4 AM”) which implies you are rolling onto your back during REM. This is actionable intel you can fix with a backpack or wedge pillow.
3. Apple Watch “Apnea Notifications” vs. O2Ring
With the FDA clearance of Apple’s “Breathing Disturbances” feature (Series 10/Ultra 2), do you still need the ring?
Yes. Apple provides a “Notification” over 30 days based on movement. The O2Ring provides a Nightly Graph of physiology.
The Use Case: Apple tells you that you have a problem. O2Ring tells you when and how severe it is every single night. They are complementary, not replacements.
4. Durability Warning (Long-Term Users)
After 3 years of tracking data from the community, a pattern has emerged regarding the O2Ring Strap.
The Failure Point: The silicone loop tends to tear after 18-24 months of daily use.
The Hack: Do not throw it away. Users are successfully using “Vet Wrap” (self-adhering bandage tape) or simple Velcro strips to secure the sensor unit to the finger, extending the life of the device indefinitely.
Final Thoughts:
The Wellue O2Ring is not an FDA-diagnostic device for curing diseases. It is a flashlight in the dark. It helps you distinguish between “just a bad night” and a physiological inability to breathe. For the price, it is the most valuable tool in the patient’s arsenal.
Read Next:
The Sleep Triage Test: Do You Have Insomnia, Apnea, or UARS? |
SpO2 & Oxygen Desaturation: Understanding the 3% and 4% Rule |
ResMed AirCurve 10 VAuto Review: The Best BiLevel for UARS?

By: Alex Warenstein.
Bio: Alex Warenstein is a sleep biohacker and founder of Night Time Comfort. After battling chronic insomnia and circadian disruption, he now helps others optimize their sleep using data-driven protocols. Read full story.
Disclaimer: Alex is not a doctor. This content is for educational purposes only. Always consult a specialist.